FlowPhase
Full-stack developer · Team project
An explainable IDX research workstation combining Sectors broker and ownership data with TradingView price-volume context.
Full-stack developer · Team project
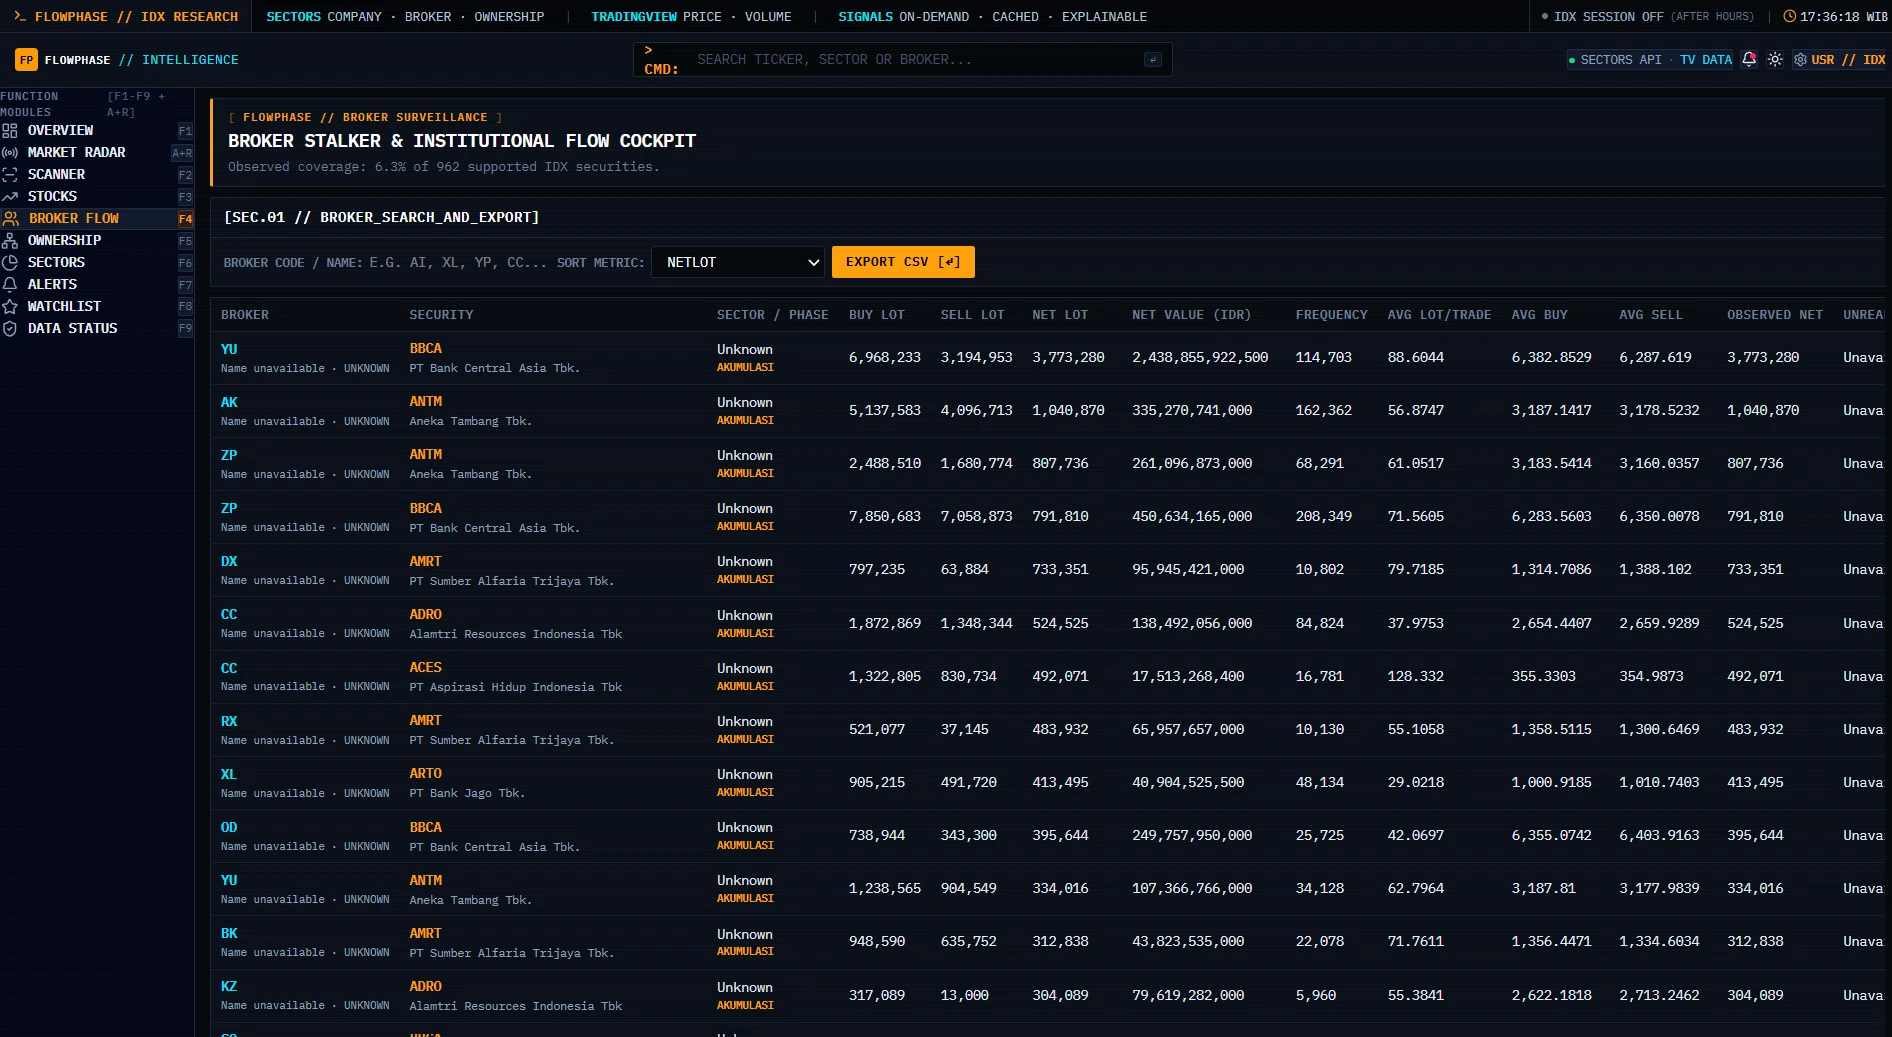
As a team, implemented a connected research workflow across the market dashboard, scanner, broker flow, stock charts, and ownership map. Screenshots document the local prototype; predictive accuracy and public deployment are not claimed.
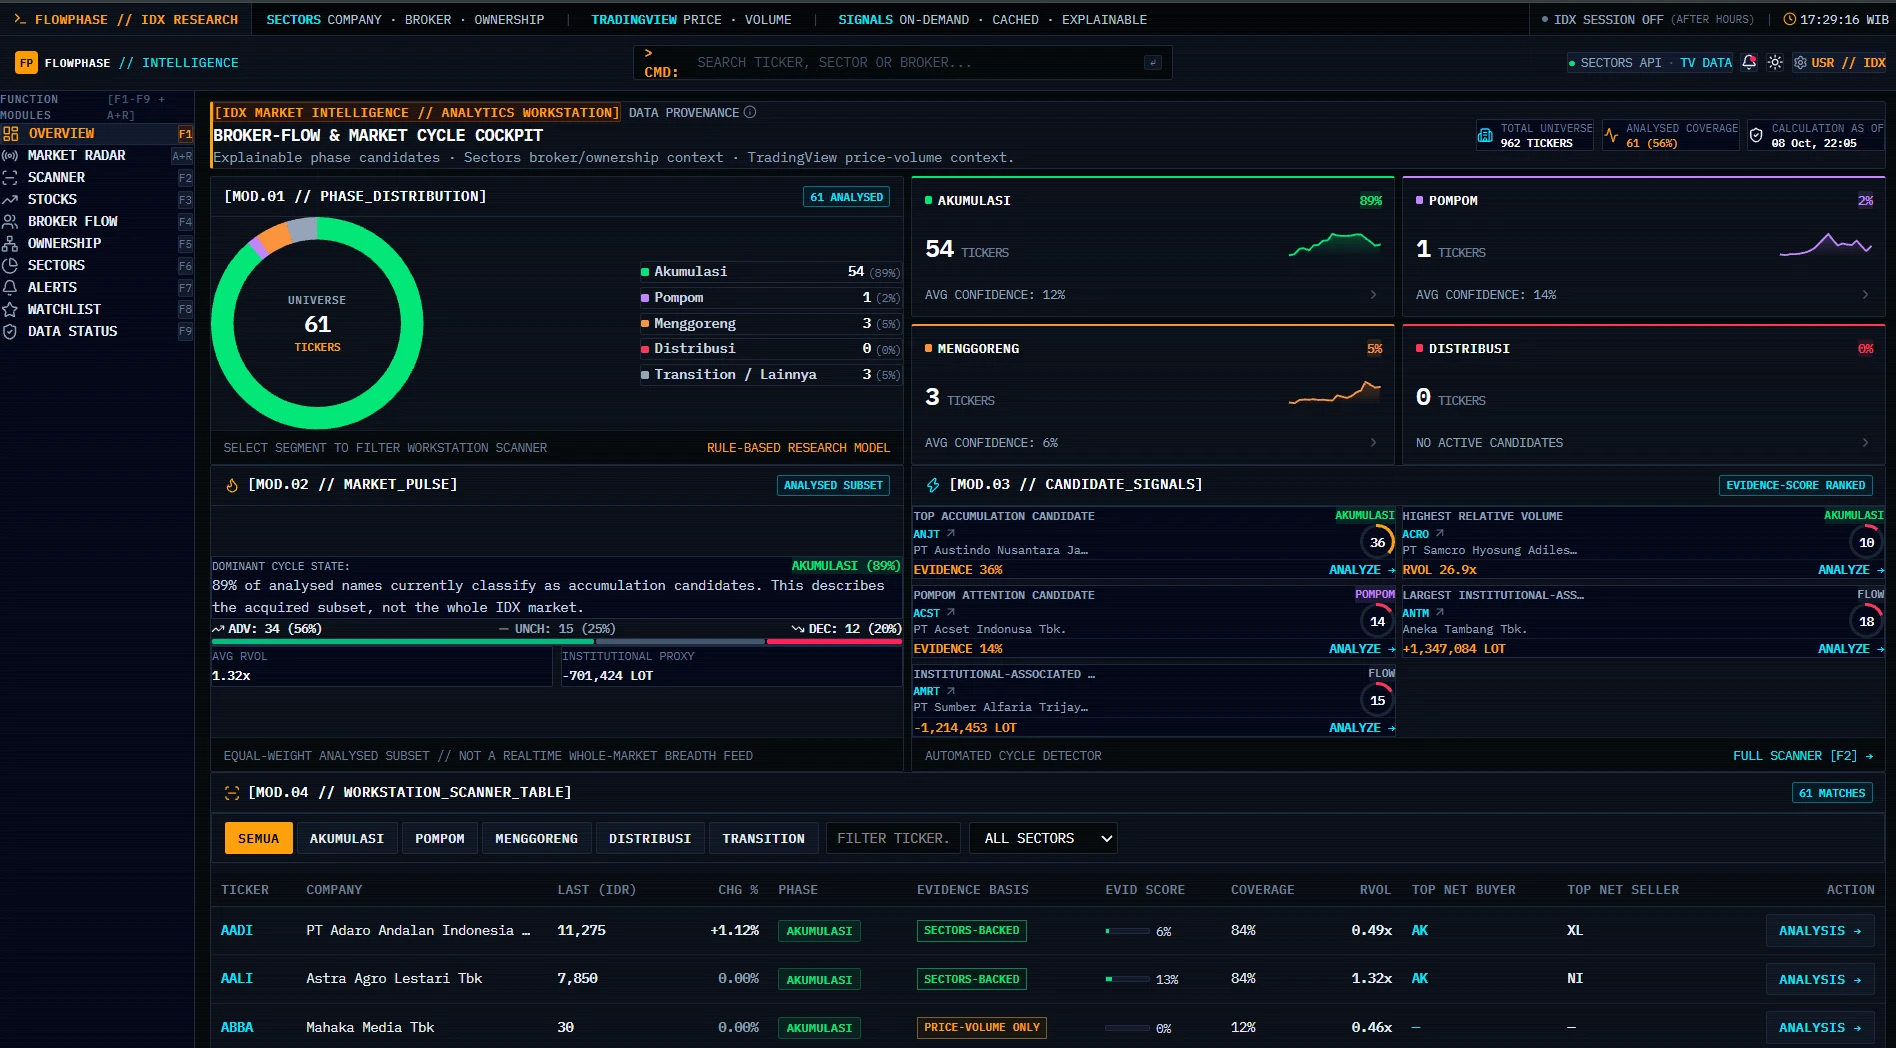
01 / 05 An explainable IDX research workstation combining Sectors broker and ownership data with TradingView price-volume context.
The problem to solve.
Built collaboratively for Sectors Hackathon 2026, Track 03 — Market Intelligence. FlowPhase brings broker flow, ownership, free float, and price-volume context into one IDX research workstation. Its deterministic rules expose supporting evidence, evidence against, and missing coverage rather than presenting phase candidates as confirmed predictions.
Problem
Market researchers need to connect broker flow, ownership, and price-volume behaviour while understanding incomplete data and the limits of each signal.
People
Indonesian equity researchers and market-analysis learners
Key decisions.
Research prototype, not investment advice or an order-execution system. Evidence scores express rule support, not profit probability. Broker flow does not identify beneficial owners. Coverage varies by acquired data; predictive accuracy is not independently validated. Public deployment requires shared quota and access controls.
What I built.
Contributed the terminal UI and theming, broker-summary and holder tabs, ownership enrichment, dashboard preloading, evidence research briefs, and chart/rendering/cache reliability fixes within the team-built workstation.
- Redesigned the terminal-style research interface and added light/dark theme support.
- Added Sectors-powered broker-summary and shareholder-holder tabs, including ownership thresholds and additional ownership context.
- Built phase-evidence research briefs with supporting evidence, cautions, next checks, and focused unit tests.
- Added dashboard stock-analysis preloading and fixed chart theme restoration, broker-metadata preservation, React rendering, and scanner cache freshness.
System architecture +
Next.js server routes fetch and validate provider data before normalising it for React research views. Sectors supplies company and broker/ownership context; TradingView supplies OHLCV rendered with Lightweight Charts. Cached analysis snapshots support the dashboard and scanner without polling the entire market.
Results, with context.
As a team, implemented a connected research workflow across the market dashboard, scanner, broker flow, stock charts, and ownership map. Screenshots document the local prototype; predictive accuracy and public deployment are not claimed.
Lessons & next steps +
- Separate observed data from inferred phases and make missing evidence visible.
- Bound provider requests and cache research snapshots to control API usage.
- Keep credentials on the server and distinguish provider-reported ownership from official verification.
Under the hood.
Technologies & features +
Next.js / React / TypeScript / Tailwind CSS / Sectors API / TradingView / Lightweight Charts / Zod / Vitest / Playwright
- Market dashboard and filtered IDX scanner
- Broker-flow analysis and CSV export
- Interactive candlestick charts and calculated phase regions
- Ownership and shareholder relationship map
- Evidence scores, source status, and missing-data indicators
- Local research watchlist and replay workflow